In this guide
“Even small wording differences can substantially affect the answers people provide.”
Pew Research Center, “Writing Survey Questions”, methods page, read 19 November 2026
You have a decision with a date on it, a half-built survey, and maybe an AI research report that reads well. Here is how to do market research that survives the first skeptical question: start from the decision, find what is already known, talk to people before you count them, and keep a chain of custody for every number, so anyone can trace it back to who said or did what, where and when.
Market research is a decision process, not a survey. The cheap shortcuts carry error that has been measured. In Pew Research Center’s comparison of six US samples against 28 benchmarks (fielded June to July 2021, published 7 September 2023), opt-in online samples were off by 5.8 percentage points on average, about twice the 2.6 points of probability-based panels, and 11.2 points for adults aged 18 to 29. Since June 2026, the American Association for Public Opinion Research (AAPOR) code says AI-generated responses are not research participants, and that data made of them should not be called a survey.
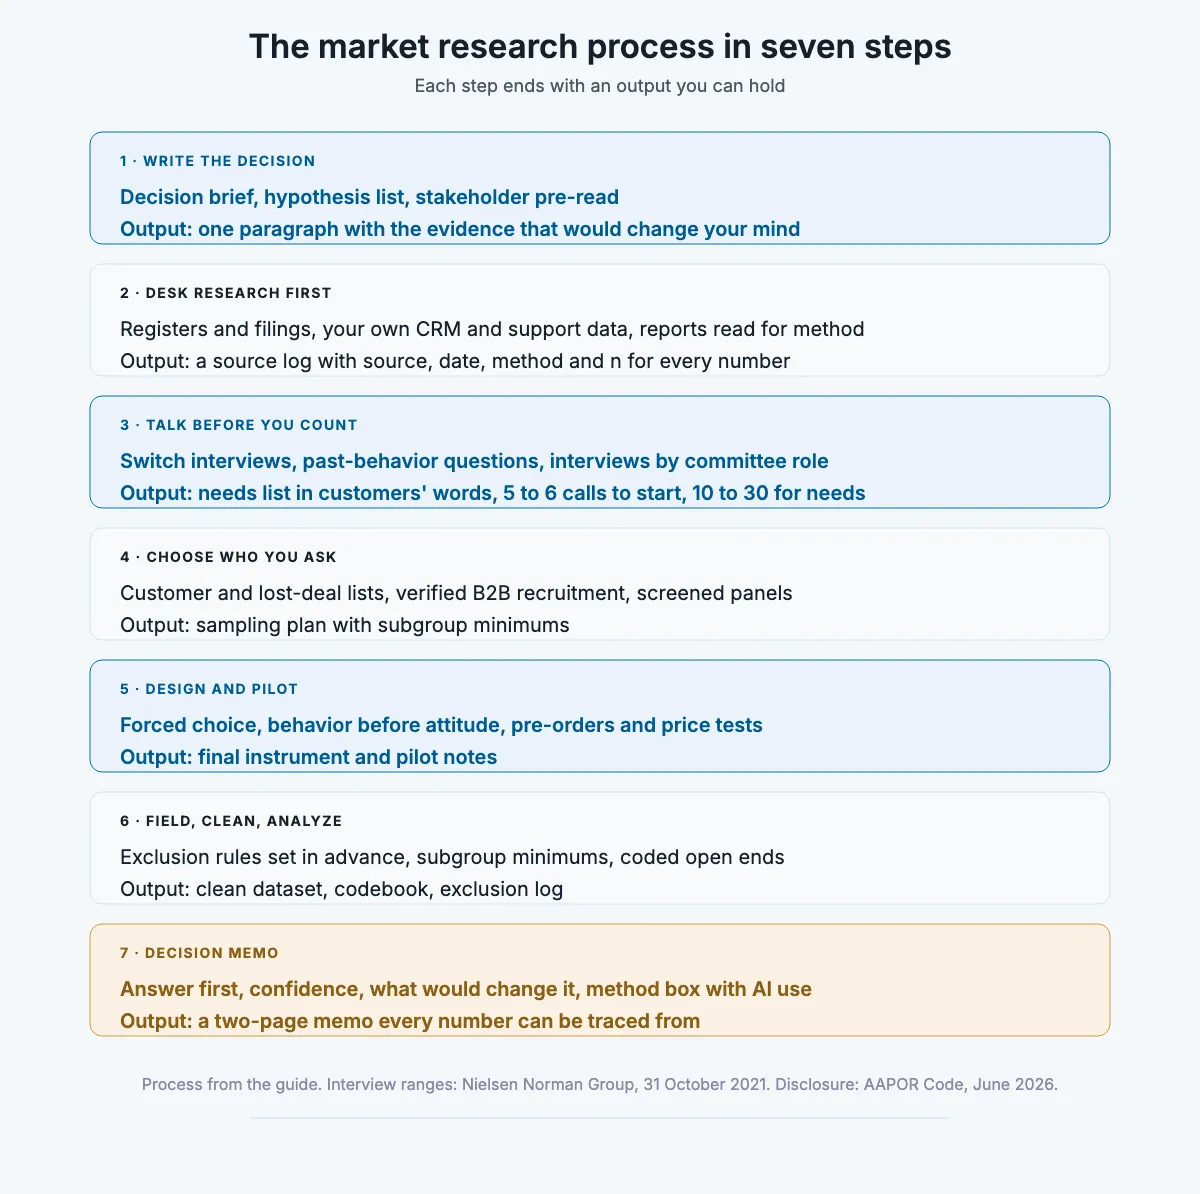
So the market research process below is seven steps, each with the two or three methods practitioners use and the output you should hold when the step is done. If you skip a step, you still need its output. You just produce it worse.
| Step | Methods practitioners use | Output you hold when done |
|---|---|---|
| 1. Write the decision | Decision brief · hypothesis list · stakeholder pre-read | One-paragraph decision brief with the evidence that would change it |
| 2. Desk research first | Public registers and filings · your own CRM, support and search data · analyst reports read for method | Source log: every number with source, date, method and n |
| 3. Talk before you count | Switch interviews · past-behavior questions (The Mom Test) · interviews by buying-committee role | Needs list in customers’ words, plus a language bank |
| 4. Choose who you ask | Your customer and lost-deal lists · verified B2B recruitment · opt-in panel with screening · probability panel | Sampling plan with subgroup minimums |
| 5. Design and pilot | Forced-choice questions · behavior before attitude · behavioral tests (pre-order, price test, smoke test) | Final instrument and pilot notes |
| 6. Field, clean, analyze | Exclusion rules set in advance · subgroup minimums · coded open ends with human spot checks | Clean dataset, codebook, exclusion log |
| 7. Report as a decision memo | Answer first · confidence and what would change it · method box | Two-page memo the decision-maker can act on |
How we know
Survey quality: three Pew Research Center methods studies (7 September 2023, n of six national samples; 5 March 2024; 27 August 2026, n = 11,114) and Pew’s question-wording guidance.
Standards: the AAPOR Code of Professional Ethics and Practices as amended June 2026, read in full.
Interviews: Nielsen Norman Group on interview sample sizes (31 October 2021) and synthetic users (21 June 2024).
AI accuracy: PNAS (Westwood, 2025), Nature Communications (Wu et al., 16 April 2025), the Tow Center test reported by Nieman Lab (March 2025) and Vectara’s leaderboard (22 October 2026).
What this cannot tell you: how contaminated B2B “decision-maker” panels are. All the public panel evidence is US consumer research, and no B2B validation with a stated method exists that we could find.
The short version
Start from the decision: write what you will do differently depending on the answer, before choosing any method.
Read before you ask: public registers, filings and your own CRM answer more than most teams expect.
Interview before you survey: 5 to 6 interviews to start, 10 to 30 to map needs, more when a committee buys.
Treat stated intent with suspicion: for “will they pay”, test behavior, not opinion.
Opt-in panels give direction, not prevalence: and no screening method fully fixes them.
AI drafts, reads and codes: a person opens every source before a number enters the memo.
Why market research produces numbers nobody can defend
“purging bogus cases lowers error on most metrics, but a surefire solution remains elusive.”
Andrew Mercer, Pew Research Center, “No Easy Fix for Bogus Respondents in Online Opt-In Polls”, 27 August 2026
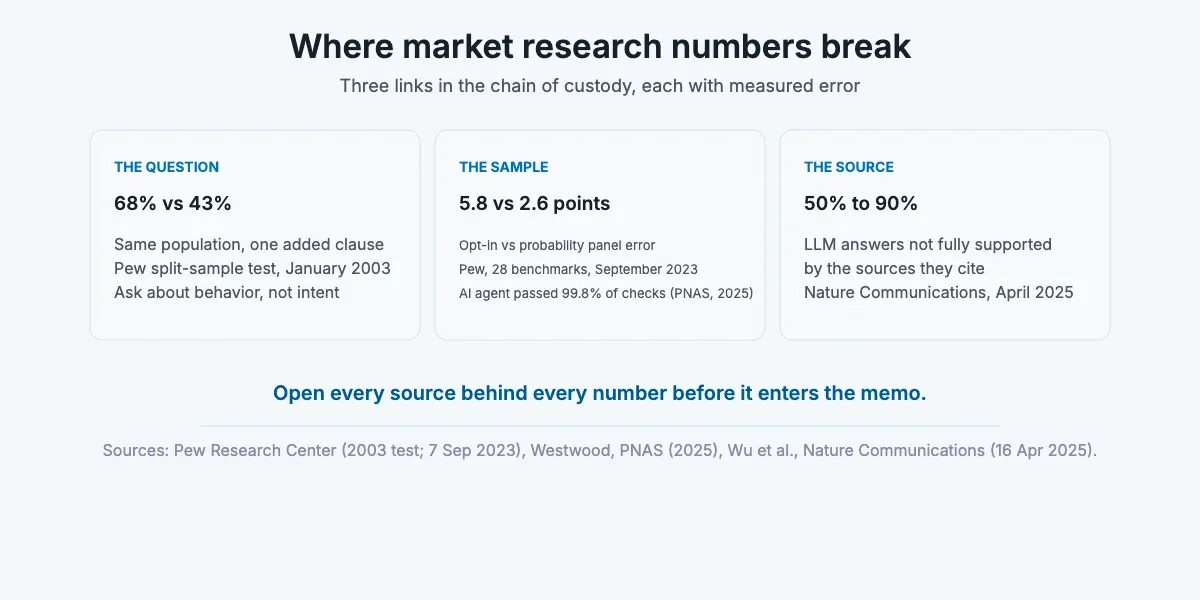
Bad research breaks at one of three links in the chain of custody: the question, the sample or the source. Each failure has been measured, and each one produces a confident number.
The question. In Pew’s January 2003 split-sample test, 68% favored military action, and 43% did when the question added that US forces might suffer thousands of casualties. In a 2008 test, 58% chose “the economy” from a list, but only 35% volunteered it when the question was open-ended. The same population gave both answers. That is why a “would you buy this at $X” result tells you about your question as much as your market. One founder on Hacker News (22 May 2025) put the usual ending plainly: “I ran a survey people said would love to pay 5$ a month but no one converted when I added premium modal.”
The sample. Opt-in online panels carried about twice the error of probability panels in Pew’s 2023 study, and the gap widened for young adults. In a February 2022 Pew experiment, 12% of opt-in respondents under 30 said they were licensed to operate a nuclear submarine, a qualification held by roughly 0% of Americans. In a separate pair of 2023 and 2024 surveys, 20% of under-30s in an opt-in poll agreed “The Holocaust is a myth”, against 3% on Pew’s probability-based panel. Bogus respondents say yes to almost anything, and in Pew’s tests they clustered among young and Hispanic respondents, exactly the kind of subgroup marketers want to read.
Screening helps less than vendors imply. Pew’s August 2026 test screened 11,114 opt-in respondents (fielded 14 to 19 November 2024) three ways: trap questions flagged 1,963 (18%), an automated prescreen flagged nearly half, and voter-file matching removed 64% and “slightly increased error by removing mostly good respondents”. And a 2025 PNAS study by Sean Westwood built an AI respondent that passed 99.8% of 6,000 standard attention-check trials, at about $0.05 a survey. That shows capability, not how often it happens. It does mean an attention check no longer proves a human answered.
The source. AI research tools cite sources, and citations are not verification. A Nature Communications study (Wu et al., 16 April 2025) found that between 50% and 90% of LLM responses were not fully supported by the sources they cited, in medical questions. The Tow Center’s test of eight AI search tools on 1,600 queries (March 2025, reported by Nieman Lab) found they failed to retrieve the correct source information more than 60% of the time. And in a JMIR Mental Health study of GPT-4o (12 November 2025), fabricated citations rose from 6% on a well-covered topic to 28% and 29% on two narrower ones. A niche B2B market sits closer to the narrow case.
Condition: this evidence is US consumer research and 2024 to 2025 tool versions. Nobody has published a method-stated test of B2B panels or of late-2026 research modes on business questions, so treat both as unmeasured, not as safe.
The fix is a process that checks each link.
Quick Summary: why do market research results go wrong?
Because the question shapes the answer (68% vs 43% on one clause in Pew’s test), opt-in samples carry about twice the error of probability panels, and AI tools cite sources that do not support their claims in 50% to 90% of responses in one 2025 study.
Insight: what the PNAS study changed
Westwood’s synthetic respondent kept a consistent demographic persona and a memory of its earlier answers, and passed standard attention checks in 99.8% of 6,000 trials. The paper rates open-enrollment river sampling as most at risk and address-based sampling as likely immune. (Sean J. Westwood, PNAS, 2025.)
Match the method to the question before you pick a tool
Every research question has a method that answers it and several that only look like they do. The error to avoid is using a survey for everything, including questions a survey cannot answer, such as whether people will pay.
| What you need to know | Method that answers it | Works when | Fails when |
|---|---|---|---|
| What problem exists and how people describe it | Interviews (switch interview, past-behavior questions) | You do not yet know the options or the language | You ask about the future or pitch the idea |
| How many people have it, or which option ranks first | Survey | The options and language came from interviews | The sample is unscreened, or you need a published prevalence figure from an opt-in panel |
| Whether people will pay | Behavioral test: pre-order, price test, smoke-test page with a small paid test | Real money or a real commitment is asked for | You substitute “would you buy” survey answers |
| Why you lose deals | Buyer interviews after the decision | Done within weeks, ideally not by the account’s seller | You rely on CRM loss-reason fields alone |
| Who decides in a B2B purchase | Interviews by committee role | You recruit two or more roles per account | You interview one champion and generalize |
| How big the market is | Bottom-up count from a register, times an evidenced price | Buyers are countable in a register or list | You take a syndicated figure whose method is not published |
For B2B, the unit is the buying committee, not the person. In LinkedIn’s 2025 survey with Ipsos of about 900 B2B buyers in seven markets, 40% reported larger buying committees, and buyers shortlist 2 to 3 vendors. Committee counts vary widely by study, so recruit by role rather than to a target headcount. How those committees behave is covered in our guide to how B2B buyers buy now.
For B2C, the risk is the sample, not the committee. A large general-population question with screening can run on an opt-in panel for direction. A claim about how many 18 to 29 year olds do something should not, unless you can pay for a probability sample.
Pick the method, then the tool.
Quick Summary: which market research method should you use?
Interviews to find the problem and the words, surveys to count what interviews found, behavioral tests to learn whether people will pay, and bottom-up counts to size a market. In B2B, interview by committee role.
Insight: what synthetic users get wrong
When Nielsen Norman Group reran three real interview studies with AI-generated users in June 2024, the synthetic participants listed needs without priority, praised concepts and described idealized behavior that the real participants contradicted. NN/g’s verdict: they “often provide shallow or overly favorable feedback.” (Rosala and Moran, NN/g, 21 June 2024.)
So here is the process, step by step.
The market research process in seven steps
Each step below starts with a first action in a named tool, lists the methods, says what you hold when it is done, and says when to skip or change it. Budget two to six weeks for one decision, most of it in steps 3 and 6.
Step 1. Write the decision, not the topic
First action: open a Google Doc and write one paragraph: the decision, the options, the evidence that would move you from one option to another, the deadline, and who decides. “Research the mid-market segment” is a topic. “Launch a mid-market tier in Q2 if at least 8 of 15 mid-market buyers describe the same unsolved problem and two pre-commit to a pilot” is a decision with a threshold.
Methods practitioners use: a decision brief, a hypothesis list with one testable sentence per belief (the way HBS Online’s startup guide frames step one), and a stakeholder pre-read so the person who decides agrees with the threshold before any data arrives. If you work in a company where research has been ignored before, the pre-read matters more than the brief.
Output: the decision brief. Every later step gets checked against it.
Why it matters: when researchers audited more than 20 consultant-run SWOT analyses from a UK government scheme covering 50 firms (Hill and Westbrook, Long Range Planning, 1997), the lists averaged more than 40 unprioritized factors and nobody used them later in the strategy process. Research without a decision ends as a library.
- Can you write what you will do differently for each possible answer?
- Has the decision-maker agreed the threshold in writing?
- Is there a date after which the answer stops being useful?
If the brief takes more than a page, the decision is not clear yet.
Step 2. Do desk research before you ask anyone anything
First action: create a source log in Google Sheets with six columns: claim, number, source URL, date read, method, sample size. Nothing enters the memo unless it has a row. This is where the chain of custody starts.
Methods practitioners use:
- Public registers and filings. In the US, Census County Business Patterns counts establishments, employment and payroll by industry, geography and employee-size class. It counts establishments, not companies, and the Census page itself (revised 8 October 2026) says its information is no longer current while the Bureau reviews how it protects data from disclosure. The SEC’s EDGAR full-text search covers filings since 2001, which makes competitors’ and customers’ 10-K risk factors searchable by phrase. Google Trends shows relative interest on a 0 to 100 scale, not search volume, so use it for direction and seasonality only.
- Your own data. CRM won and lost deals for the last 12 to 18 months, support tickets, sales call notes, on-site search terms. Treat CRM loss reasons as hypotheses: in Salesforce’s 2024 survey of 5,500 sellers, only 35% fully trusted their own organization’s data.
- Analyst and trade reports, read for method. If a market-size figure has no definition, sample or date, log it as “method not published” and keep it out of the memo.
Output: the source log and a one-page “what we already know” note. Strike every planned question it already answers.
Skip the register work only when the decision is about an existing product’s customers and your own data covers them.
- Does every number in the log have a source you opened yourself?
- Which planned survey questions does the desk research already answer?
- Which figures are someone else’s estimate rather than a count?
An empty “method” column is a finding too.
Step 3. Talk to people before you count them
First action: book 5 to 6 calls this week with recent buyers and recent losers, people who made or rejected a purchase in the last 90 days. Recent decisions are remembered as events, not opinions.
Methods practitioners use:
- The switch interview (Bob Moesta and Chris Spiek): rebuild the timeline from first thought to purchase, and map the four forces, push, pull, anxiety and habit.
- The Mom Test rules (Rob Fitzpatrick): ask about specific past behavior, never about the future, and never pitch your idea during the interview.
- Interviews by role when a committee buys: the user, the budget owner and the person who signs off answer different questions.
How many: Nielsen Norman Group recommends starting with a small sample of 5 to 6 and continuing while you are still learning, and warns that 5 is too few for many exploratory studies. Voice-of-customer studies typically run 10 to 30 one-hour interviews (Gaskin, Griffin, Hauser and colleagues, 2011), and in Griffin and Hauser’s classic study 20 to 30 surfaced an estimated 90% to 95% of needs in one category. In Hennink and colleagues’ 2017 study, themes appeared by about 9 interviews but understanding them took 16 to 24. The often-quoted “12 interviews” comes from one homogeneous study, so a mixed B2B committee needs more, split by role.
Get consent before you record. Recording rules vary by jurisdiction, so check yours before the first call. If you sell into a committee, budget at least two interviews per role.
Output: a needs list written in customers’ own words, and a language bank you will reuse in the survey and in your copy.
- Did every question ask about something that already happened?
- Did you talk more than a third of the time?
- Are you still hearing new reasons, or the same ones?
If the calls feel repetitive, that is the point at which to stop.
Step 4. Choose who you will ask
First action: write a sampling plan in the decision brief: the population, where you will reach them, the target number and the minimum per subgroup you will report. Decide the subgroups now, because a subgroup of 40 cannot carry a percentage you will put in a memo.
Methods practitioners use, by condition:
- Your own customer and lost-deal lists. Best for B2B and for any question about current buyers.
- Verified recruitment for B2B. LinkedIn outreach, customer communities and expert networks, screened by role and company.
- An opt-in panel with screening for directional questions on a large, general consumer population.
- A probability panel only when the decision needs a prevalence figure you will publish or defend externally.
For B2C on a small budget, an opt-in panel with screening is acceptable for ranking options and for direction. For B2B, buying “decision-maker” completes from a sample exchange you cannot verify is a risky line in any research budget, because nobody has published how contaminated those panels are.
- Is the subgroup you care most about large enough to report on its own?
- Could you verify the job title of every B2B respondent?
- Does the decision need a prevalence number, or only a ranking?
A small, verified sample usually beats a large, unknown one.
Step 5. Design the instrument, then pilot it
“Pretesting a survey is an essential step in the questionnaire design process.”
Pew Research Center, “Writing Survey Questions”, read 19 November 2026
First action: map every draft question to a line in the decision brief, and delete any question no decision depends on. Then write the rest in your customers’ words from step 3.
Methods practitioners use:
- Forced choice over agree and disagree scales. Pew’s guidance: “A better practice is to offer respondents a choice between alternative statements”, because agree-disagree formats pull answers toward yes.
- Behavior before attitude. Ask what they did last time before you ask what they think.
- A behavioral test when the decision is “will they pay”. A pre-order, a deposit, a price test on a live page or a smoke-test landing page behind a small paid campaign (our guide to performance marketing fundamentals covers the campaign setup). A “would buy” answer costs the respondent nothing, so ask for a commitment instead of an opinion.
- A pilot with 5 real people, who read each question aloud and say what they think it means.
An AI-generated pilot is acceptable for one job only: catching confusing wording before real people see it. NN/g lists preparing and piloting interview guides among the acceptable uses of synthetic users, and it is never a substitute for the real pilot.
Output: the final instrument and a short pilot note on what changed.
- Does any question assume the answer you hope for?
- Would a respondent who has never heard of you understand every option?
- Is there a behavioral question for every intent question?
Two rounds of piloting is normal, not a delay.
Step 6. Field, clean and analyze
First action: before launch, write your exclusion rules in the analysis plan: failed trap questions, speeders, straight-liners and nonsense open ends. Rules written after you see the data tend to remove the answers you dislike.
Methods practitioners use:
- Quality screens, knowing their limits: in Pew’s 2026 test they reduced error modestly and none removed it, and an AI agent passed 99.8% of standard checks in the PNAS study.
- Subgroup minimums and the margin-of-error arithmetic. For a simple random sample, Pew’s worked example (8 September 2016) is that 1,067 cases give about plus or minus 3 points, a subgroup of about 160 gives about plus or minus 8, and the margin on a difference between two numbers is about twice that of either one. If two options are 4 points apart in a 400-person survey, you have not found a winner.
- No margin of error on opt-in samples unless you state the model. AAPOR’s June 2026 code allows a precision measure for a non-probability survey only if the model behind it is described, and otherwise expects a statement that precision measures are not provided.
- Coded open ends. Code to the needs list from step 3, and spot-check any AI coding against the raw text.
Output: a clean dataset, a codebook and an exclusion log that says how many responses you removed and why.
- Were the exclusion rules fixed before fielding?
- Is any reported subgroup below your minimum?
- Does any “difference” sit inside the margin of error?
Check every surprising finding against the exclusion log before you report it.
Step 7. Report it as a decision memo
First action: write the answer to the step 1 decision as the memo’s first sentence. “Launch the mid-market tier in Q2” or “Do not launch yet, because only 3 of 15 buyers described the problem.” Then the evidence.
Methods practitioners use:
- Answer, confidence, and what would change it. One line each.
- A method box. Sample type and source, fieldwork dates, n, exact question wording for the key numbers, exclusions, and how AI was used. AAPOR’s June 2026 code requires disclosing AI use in data collection or processing, including what the AI did, such as generating responses, interviewing, cleaning data or producing estimates.
- The findings that did not support the decision, kept in. Leaving them out is how a study becomes a sales document.
Output: a two-page memo, with the source log and dataset attached. Unless the decision-maker asks for slides, do not make them. The chain of custody is complete when every number in the memo traces to a row in the log or a cell in the dataset.
- Is the answer in the first sentence?
- Could a skeptic find the exact wording behind each headline number?
- Is AI use disclosed, task by task?
If the memo needs a deck to explain it, it is not finished.
Quick Summary: what are the steps of the market research process?
Write the decision, do desk research, interview before you survey, choose and verify your sample, design and pilot the instrument with behavioral tests where money is involved, field and clean with rules set in advance, and report as a decision memo with a method box.
Insight: AAPOR’s line on AI-generated data
Since June 2026, AAPOR’s code defines data generated or modeled through AI, such as silicon responses, digital twins and synthetic responses, as not coming from research participants, and says words like poll and survey should not describe it. Any AI use in collecting or processing data must be disclosed. (AAPOR Code of Professional Ethics and Practices, amended June 2026.)
Pulling it together: a six-week plan
Week 1, decision and desk research. Write the brief, get the threshold agreed, and fill the source log from registers, filings and your CRM. Commit: the decision-maker signs off the threshold by Friday.
Weeks 2 and 3, interviews. Run 5 to 6 interviews, read them, then continue to 10 to 30, split by role if a committee buys. Commit: a needs list in customers’ words by the end of week 3.
Week 3, sampling plan. Decide the population, the source and subgroup minimums while interviews run. Commit: the sample source is booked or the customer list is cleaned.
Week 4, instrument and pilot. Write from the needs list, pilot with 5 people, revise, and set up any behavioral test. Commit: the instrument is final by Thursday.
Week 5, fielding and cleaning. Apply the exclusion rules you wrote in advance. Commit: an exclusion log with every removal counted.
Week 6, memo. Answer first, method box, contrary findings kept. Commit: the memo goes to the decision-maker before the deadline in the brief.
For a reversible decision with a small budget, compress this to two weeks: desk research, 6 to 8 interviews and a behavioral test, no survey. For a decision that needs a published prevalence figure, add the time a probability sample takes, which is weeks of a vendor’s fieldwork.
Build it with AI
Build it with AI, step by step
“If you’re using synthetic users in your research process, they should complement, not replace, real research.”
Maria Rosala and Kate Moran, Nielsen Norman Group, 21 June 2024
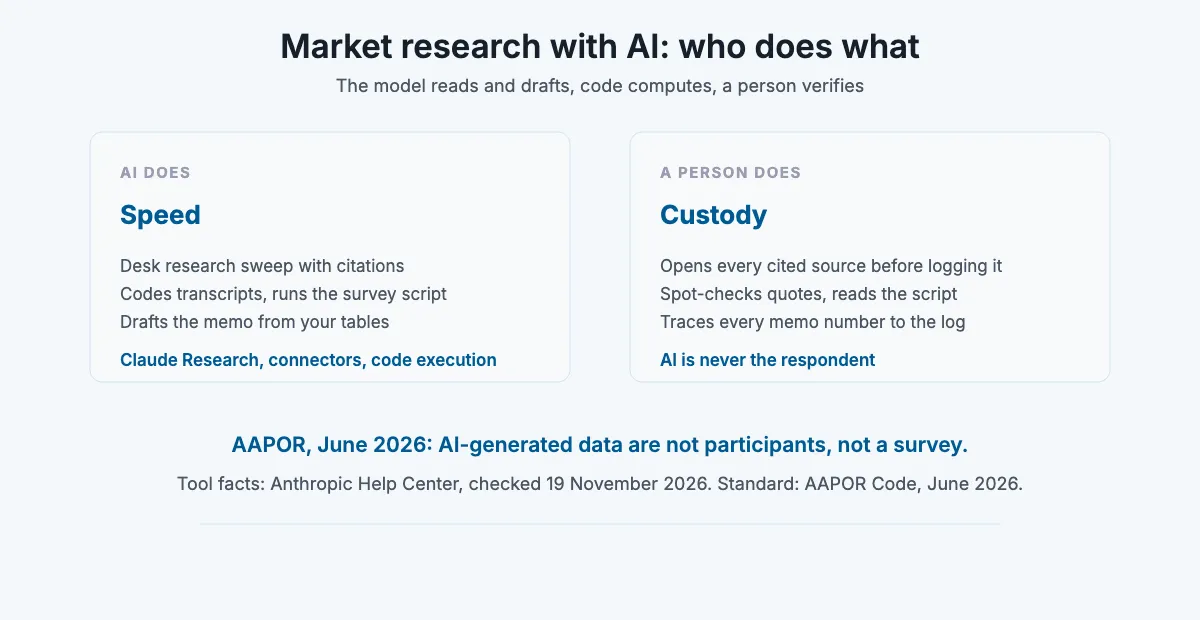
AI speeds up reading, coding and drafting at every step, but it never answers on behalf of a respondent, and nothing it cites enters the memo until a person has opened the source. The architecture that holds up is simple: the model reads and drafts, code computes the numbers, and a human verifies each link in the chain of custody.
| Step | AI method | Tool or connector (checked 19 November 2026) | Where it fails | Human checkpoint |
|---|---|---|---|---|
| 1. Decision | Draft the brief and challenge the threshold | Any assistant, with the brief in a Claude Project | Agrees with whatever you wrote | Decision-maker signs the threshold |
| 2. Desk research | Multi-search sweep with citations | Claude Research, Gemini Deep Research, ChatGPT deep research | Unsupported and fabricated citations, worse on niche topics | Open every source behind every number before it enters the log |
| 3. Interviews | Transcribe, code to needs and forces, pull verbatims | Transcripts in Google Drive, read through Claude’s Google Drive connector | Paraphrased “quotes” and misattributed speakers | Spot-check each quote against the transcript |
| 4. Sampling | Draft the plan and subgroup minimums | Any assistant | Invents population counts if not given data | Counts from registers you opened in step 2 |
| 5. Instrument | Critique wording for leading questions, order effects, double-barreled items | Docs connector or pasted draft | Generic questions | Real pilot with 5 people |
| 6. Analysis | Clean and cross-tab the raw export with code | Claude code execution on an uploaded CSV | Narrates numbers it did not compute | Check the script’s exclusions and totals |
| 7. Memo | Draft the memo from your tables, then run a source check | Claude Project with the source log | Adds claims that are not in your data | Every number traced to the log or dataset |
| CRM read | Pull won and lost deals for desk research | HubSpot remote MCP server or HubSpot’s ChatGPT connector | Bad writes at scale | Read-only, or writes set to “Needs Approval” |
Setup. Create one Claude Project per study and load the decision brief, the source log and the interview guide as project knowledge. Claude Research runs multiple searches that build on each other, needs web search turned on, and is on paid plans (Pro, Max, Ultra, Team and Enterprise) as of 19 November 2026. It can search your connected Google Workspace, but not on mobile, and local MCP servers configured in Claude Desktop are not available to it. Claude’s Google Workspace connectors let the Drive connector read Sheets, Docs and PDFs as text, and live editing of Sheets needs the separate Sheets connector. Claude’s code execution and file creation is on all plans and accepts CSV and TSV uploads up to 30MB per file. Gemini Deep Research, introduced in December 2024, can draw on Gmail, Drive and Chat if you allow it. For CRM data, HubSpot’s remote MCP server at mcp.hubspot.com lists read and write access to CRM objects, but its own page is inconsistent about write scopes, so connect it read-only first.
Workflow 1, desk research with a source check (step 2). Run Research with a prompt like this:
“Find primary sources for [market question] in [geography], [year range]. For every number, give the exact figure, the publisher, the publication date, the method and sample size, and the URL of the primary document, not a news story about it. If you cannot find the primary, say so and give no number. Output a table with those six columns.”
Paste the table into the source log, then open every URL yourself. Delete any row where the page does not say what the table claims. Expect to delete some: in the Nature Communications study, between 50% and 90% of responses were not fully supported by their own citations, and OpenAI’s own February 2025 system card for deep research still reported a 13% hallucination rate on its facts-about-people test.
Workflow 2, survey analysis on the raw export (step 6). Upload the CSV and ask Claude to write and run a script that applies your written exclusion rules, reports the number removed per rule, and produces the cross-tabs you planned, with n per cell. Read the script before you read the chart. The model narrates. The code computes. Summaries still drift: on Vectara’s leaderboard (last updated 22 October 2026, more than 7,700 articles), models summarizing a supplied document produced unsupported statements in 1.8% to 24.2% of summaries depending on the model.
Workflow 3, interview synthesis (step 3). Put transcripts in one Drive folder. Ask Claude to code each transcript to the four forces and to your needs list, quoting the exact transcript line for each code with the file name. Spot-check every quote you plan to use.
Workflow 4, the source check (step 7). Before the memo goes out, ask the model to list every number in it with the source-log row it came from, and to flag any number with no row. Fix the flags by hand.
Schedule. Per study, plus a monthly rerun of the desk research prompt while the decision is still live, compared against last month’s source log.
Guardrails. Keep every connector read-only unless one narrow job needs writes, and put CRM writes behind approval: HubSpot’s own ChatGPT connector page advises setting writes to “Needs Approval” and notes it skips custom validation rules. Anthropic’s help page warns that files and websites can carry hidden instructions that trick Claude into running code or leaking data, which matters when Research reads competitor pages. Never use AI-generated respondents as data. Under AAPOR’s June 2026 code, they are not participants.
Quick Summary: how do you use AI for market research?
Use deep research modes for a first sweep with citations and open every source, use code execution to analyze raw survey exports, use connectors to code interview transcripts with verbatim spot checks, and run a source check on the final memo. Never use AI personas as respondents.
Insight: why the citation is where checking starts
In the Tow Center’s March 2025 test, eight AI search tools failed to retrieve the correct source information on more than 60% of 1,600 queries, and Perplexity, the best performer, still failed 37% of the time. (Tow Center for Digital Journalism, reported by Nieman Lab, 10 March 2025.)
What stopped being true
“These terms should not be used to describe data created through artificial intelligence.”
AAPOR Code of Professional Ethics and Practices, June 2026, on “poll” and “survey”
Several assumptions behind older market research advice no longer hold. These are the ones that change how you run a study, with the source for each.
| What used to be true | What is true now | When it changed | Source |
|---|---|---|---|
| Attention checks catch non-human respondents | An AI agent passed 99.8% of 6,000 standard checks | 2025 | Westwood, PNAS |
| Screening an opt-in panel cleans it | Traps, prescreens and matching helped modestly, none fixed the bias | 27 August 2026 | Pew Research Center |
| Opt-in panels are good enough by default | About twice the error of probability panels, worse for under-30s | 7 September 2023 | Pew Research Center |
| AI-generated respondents can be reported as a survey | Not research participants, not to be called a poll or survey, AI use disclosed | June 2026 | AAPOR Code |
| AI research meant one search and a summary | Multi-step deep research modes with citations | December 2024 to April 2025 (Gemini, OpenAI, Claude) | Vendor documentation |
| Analyzing survey data with AI meant pasting it into a chat | File upload with code execution, and connectors to Drive and CRM | 2024 to 2026 | Anthropic and HubSpot documentation |
| Talk to 5 users | 5 is for usability tests. Interviews need more, sized by saturation | 31 October 2021 | Nielsen Norman Group |
Questions people ask about market research
How many people should I interview or survey? Interview 5 to 6 to start and continue until new interviews stop teaching you anything, usually 10 to 30 to map needs, and more when a buying committee is involved. For surveys, the number depends on the smallest subgroup you will report: a random sample of about 1,067 gives roughly plus or minus 3 points overall, and a subgroup of 160 roughly plus or minus 8, per Pew’s 2016 worked example. “Twelve interviews is enough” comes from one homogeneous study and does not generalize.
How long does market research take? Two to six weeks for one decision is realistic for a small team. Recruiting and scheduling interviews take most of the time. A reversible decision can run in two weeks with desk research, interviews and a behavioral test.
How much does market research cost? There is no reliable public benchmark. Desk research, customer interviews and lost-deal calls cost time rather than money. The expensive lines are panel completes, especially verified B2B respondents, and probability samples, which you only need when a published prevalence figure is the decision input.
Can ChatGPT or Claude do market research for me? They can do the first sweep of desk research, code transcripts and analyze exports, but they cannot be your respondents. In NN/g’s June 2024 test, synthetic users gave shallow, overly favorable answers, and AAPOR’s June 2026 code says AI-generated data are not research participants. Every number an AI tool cites needs a person to open the source.
What is the difference between market research and marketing research? Market research studies a market: its buyers, size, needs and competitors. Marketing research is the broader term that also covers research on your own marketing, such as ad tests and messaging. The process in this guide works for both, because both start from a decision.
In a nutshell
One decision takes two to six weeks of elapsed time, and most of it is recruiting, scheduling and waiting for people. There is no way to compress the interviews below what saturation needs, and AI shortens the reading and coding, not the talking.
This guide does not apply when the output is a statistic you will publish or a claim a regulator may test. A prevalence figure for the public record needs a probability sample and a research partner who can show the method. For every other decision, a decision brief, a source log and a memo with a method box will take you further than a bigger survey.
About this article

Written by
Sai Subramaniam
SEO, GEO and Paid Ads Manager · 8+ years in growth marketing
I have run SEO, paid media and ABM for B2B AI companies, consumer apps and live-entertainment brands, from a solo operator at an AI infrastructure company to a team of 20 recovering a million-visitor site after a Google update. I write these guides from that work, and every number in them carries its source.
Connect on LinkedInHow this one was checked. Every number traces to a named source with its dataset and period, and every platform feature, policy or limit cites the platform's own documentation with the date it was verified. Where the author's own results appear, they are labeled as one account's results, with the budget and context, not as a rule.
No affiliate links and no paid placements. Tools are named because they are what practitioners use, not because anyone paid to appear here.
Reviewed: November 2026. Ad platforms and search features change every few months. Anything we could not verify at the time of writing is marked as unverified rather than turned into a number.
Corrections. If something here is wrong or has changed since, we would rather know. Corrections are made in place, with a note saying what changed.
Want this wired into your own account?
One call to size the problem and agree the first three moves.